
1. The scenario (context)
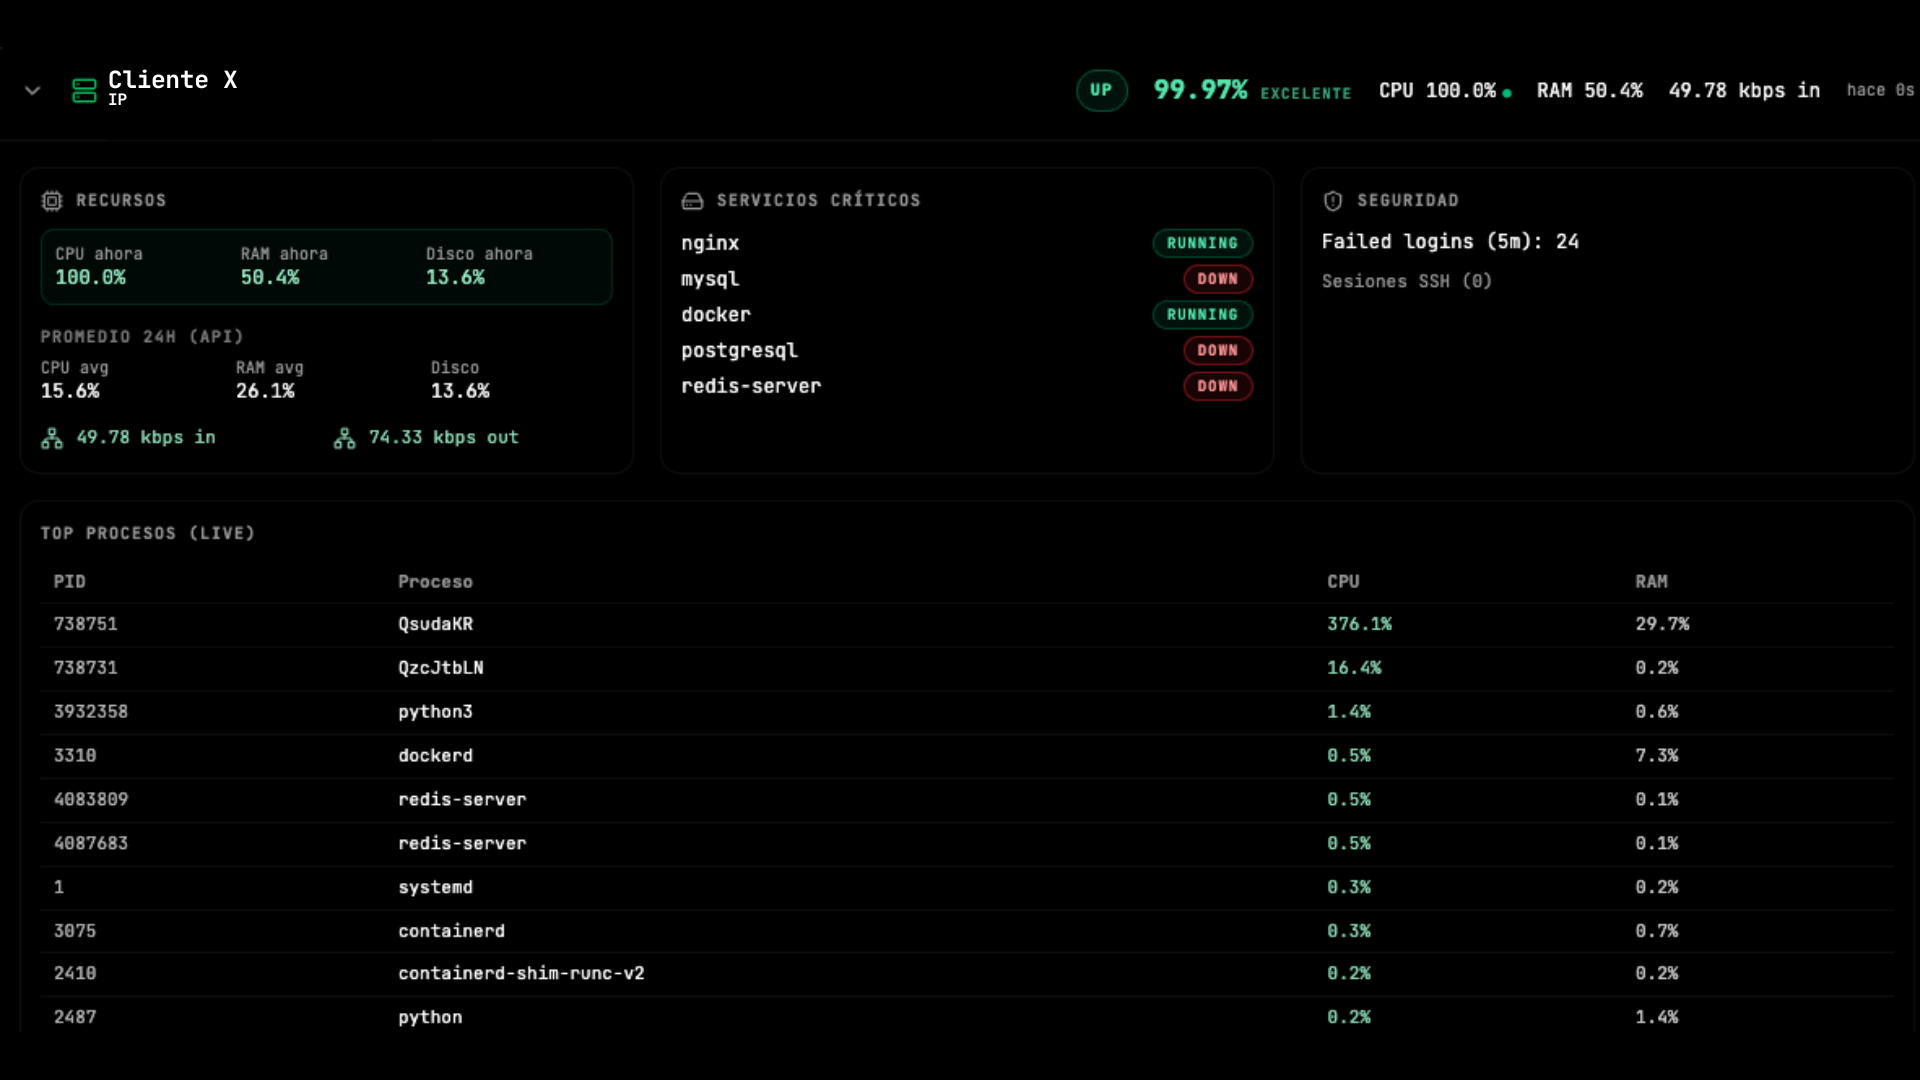
A client runs a high-performance production server on a modern stack: Next.js, Docker, Redis, and SQL databases. Everything looked stable until the metrics UI raised a critical alert.
2. Detection: the GetBundled “aha” moment
From a single dashboard capture we identified three anomalies in seconds that plain-text logs could have taken hours to surface:
Process visibility
The “Top processes (live)” view immediately showed a process named QsudaKR consuming 376.1% CPU.
Failure correlation
The same screen showed that while CPU spiked, critical services (MySQL, PostgreSQL, Redis) were down.
Intrusion indicators
The security panel showed 24 failed logins in 5 minutes—consistent with an active brute-force attempt.
Without a centralized visual interface, the client would have noticed slow web responses—but not the root cause: a malicious binary hiding among Next.js build artifacts.
3. Investigation (deep dive)
The metrics report supplied PID 738751 for a surgical response.
Malware path: the process ran from /app/.next/, pointing to web-layer risk such as RCE/SSRF exposure.
Resource impact: RAM at 50.4% and sustained CPU at 100.0% explained why the host sacrificed databases to stay up (memory pressure and OOM killer dynamics).
4. Resolution and hardening
- Stopped the process for forensic analysis.
- Identified the entry point (outdated Next.js and dependencies).
- Removed malicious artifacts and upgraded dependencies.
- Closed attack paths at the firewall, reducing login noise observed by the monitoring script.
5. Conclusion: the value of proactive monitoring
- Lower MTTR: from hours to minutes.
- Prevent larger damage: runaway cloud bills and customer data exposure.
- Data-driven security: decisions from live process metrics, not guesses.
6. Efficiency: “invisible” monitoring vs invasive malware
A classic monitoring trap is the observer paradox: telemetry that costs so much CPU it distorts what it measures. In this incident the gap was stark.
Malware impact: QsudaKR was observed at 376.1% CPU and 29.7% RAM, starving legitimate services.
Tool impact: even under extreme load, our metrics reporter did not appear in the top 10 CPU consumers.
Visibility without penalty: at 100.0% CPU, collection kept flowing with a negligible footprint (under ~0.1% CPU), preserving signal when it mattered most.
The stack is designed to stay quiet: while malware fights for every cycle, the metrics path aims to put ground truth on your screen without taxing performance.